One number caught my attention this week: Israel’s largest banks have reportedly distributed almost two-thirds of a NIS 3 billion public-benefits commitment within a two-year framework.
The easy way to read that is as a finance headline. I think the more useful reading is operational: a large public promise is only meaningful when the organization can show the pace at which it becomes real for customers.
This is the management pattern that matters beyond banking. A commitment that remains in a deck is communication. A commitment that moves through systems, approvals, product surfaces, customer touchpoints, support scripts, and measurement loops becomes execution. The difference is trust.
A Commitment Without Execution Rate Is Just PR
Large organizations are very good at announcing intent. They publish roadmaps, benefit plans, transformation programs, AI strategies, security initiatives, and customer promises. The hard part is not the announcement. The hard part is proving that the promise is moving at a pace that customers, teams, and leadership can actually feel.
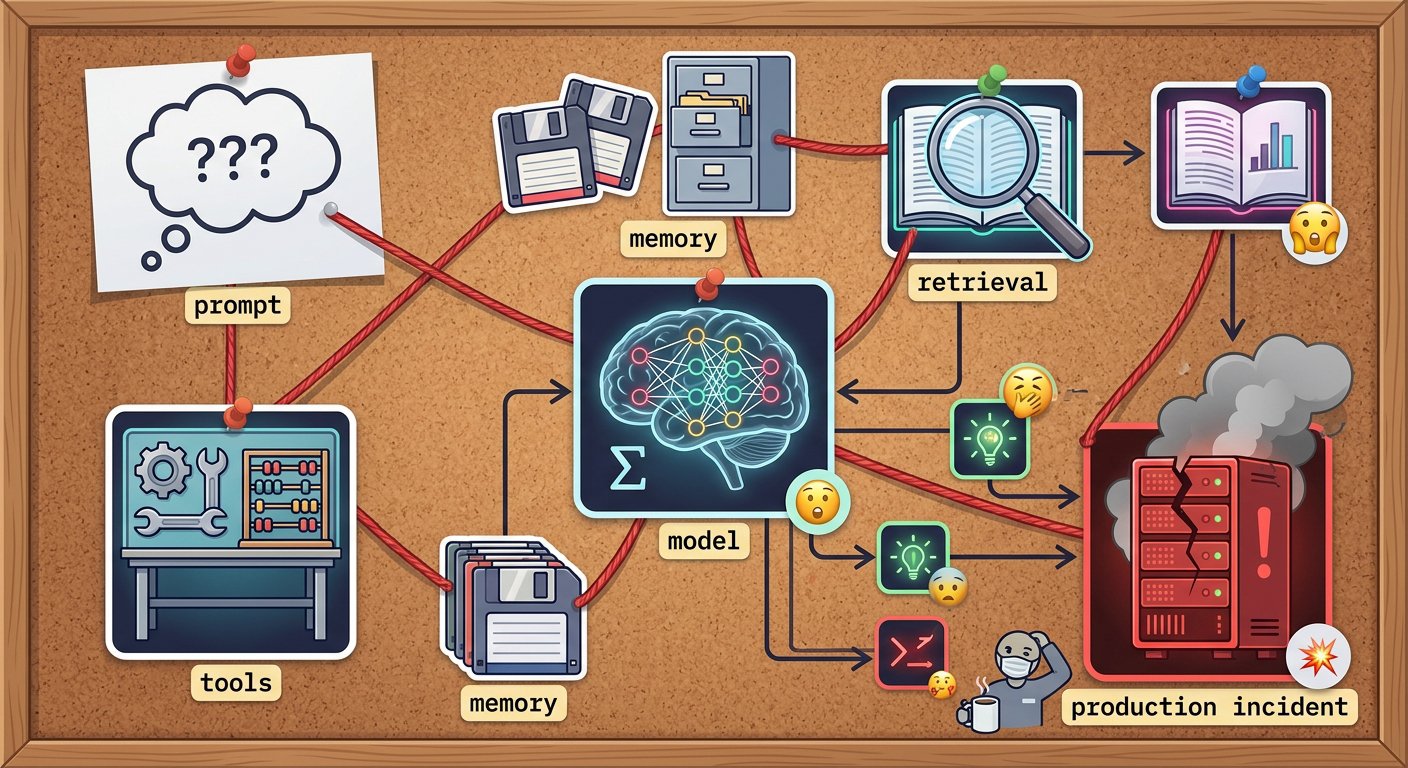
That is why I like the phrase execution rate. It forces the conversation away from intent and toward delivery. In engineering terms, it is similar to the difference between opening tickets and shipping verified value. I have written before about engineering leadership and operational discipline because the same problem appears inside technology teams: velocity can look healthy while the actual promise to users barely moves.
The useful question is not only “how much did we commit?” It is: how much of the commitment reached the intended audience, how fast, with what quality, and through which bottlenecks?
The Same Metric Applies to Product and Engineering
Product and engineering teams often measure activity because activity is easy to count. Roadmap items, story points, pull requests, sprint velocity, deployment count, and ticket throughput all create a feeling of motion. Some of those metrics are useful, but none of them automatically proves that the organizational promise reached the user.
A platform team may promise faster developer onboarding. A product team may promise lower friction for enterprise customers. A security team may promise better incident readiness. In each case, the commitment delivery rate should be measurable.
- Define the original promise. Was it cost relief, faster onboarding, lower latency, higher reliability, fewer manual approvals, or better customer visibility?
- Define the recipient. Who is supposed to feel the value: customer, user, developer, support team, finance, or management?
- Measure the delivered portion. Which part of the promise is already live, used, and visible?
- Measure the pace. Is the organization moving fast enough relative to the original timeline and expectations?
- Inspect the bottleneck. Is the slowdown caused by architecture, approval flow, data quality, ownership, vendor dependency, or weak measurement?
This connects directly to software development workflow design. A team can optimize ceremonies and still fail the user if the real promise never crosses the last mile.
Why Execution Rate Is a Trust Metric
Trust is usually discussed as a soft concept. In practice, it is often measurable. Customers trust a company more when promises become outcomes. Employees trust leadership more when strategic commitments are not abandoned quietly. Regulators and public stakeholders trust institutions more when commitments can be audited over time.
That is why “almost two-thirds distributed” is more interesting than the headline amount alone. The amount tells us the scale of the promise. The distribution rate tells us whether the machinery is moving.
The same logic shows up in technical debt. A team that says “we will improve reliability” but never connects that promise to incidents, SLOs, ownership, and user impact is creating a trust gap. The work has to be traceable. In previous RunWithRan pieces on technical decision evidence and engineering accountability, the same principle appears: evidence is what turns claims into credibility.
A Practical Execution-Rate Dashboard
If I were building an execution-rate dashboard for a leadership team, I would keep it simple. The goal is not to create another vanity dashboard. The goal is to expose the gap between promise and delivery early enough to act.
- Commitment: what exactly did we promise, and when?
- Delivered value: what portion is already in the hands of the intended audience?
- Adoption: are people actually using or receiving the benefit?
- Quality: did delivery create new friction, support load, or risk?
- Pace: are we ahead, on track, or falling behind?
- Owner: who is accountable for the next unblock?
This dashboard should be boring enough to survive contact with reality. It should not depend on heroic interpretation. If a promise is stuck, the dashboard should make the bottleneck visible: procurement, architecture, legal review, missing data, unclear ownership, or simply a commitment that was never operationally realistic.
The Operator Question
The operator question I would ask every quarter is simple: which promise did we make that still looks good in a presentation but has not moved enough in reality?
That question is uncomfortable because it cuts through status theater. It does not punish ambition. It punishes unmanaged gaps. A leadership team that can answer it honestly will make better decisions about resources, scope, and sequencing.
Context: this article expands on a Globes report about Israeli banks distributing public-benefit commitments and applies the same execution-rate lens to product and engineering organizations.